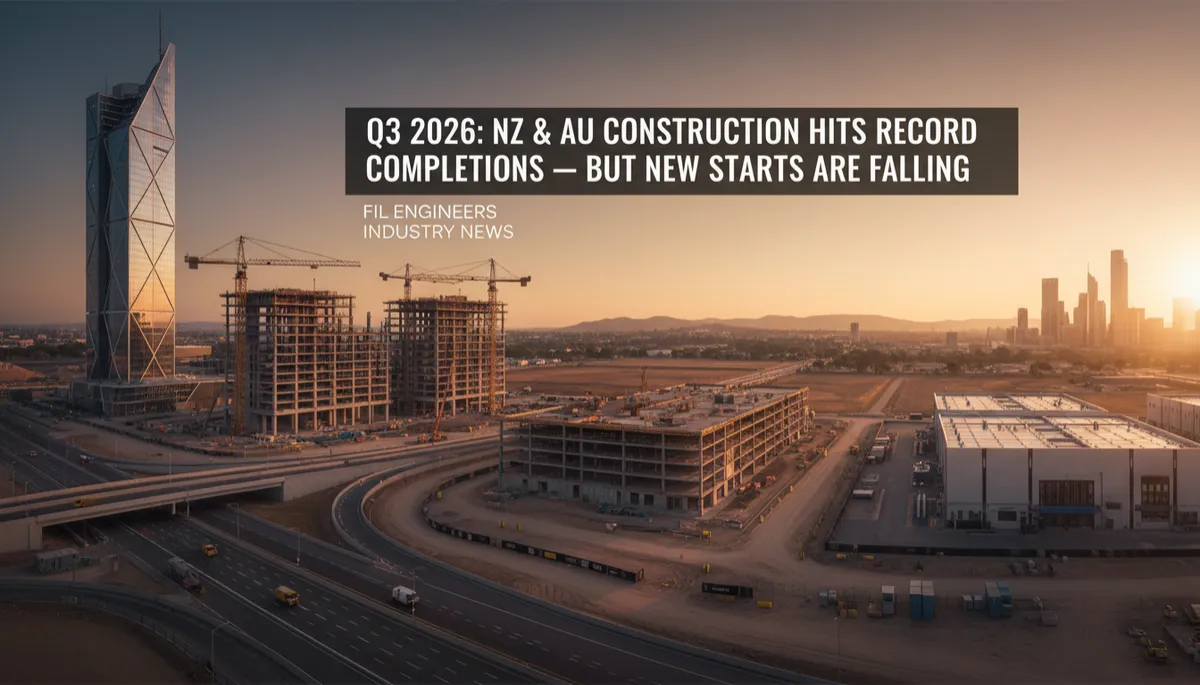
NZ & AU Construction: Record Completions in Q3 2026
Fil Engineers Industry News, Australian construction market, NZ construction 2026, Q3 2026 construction data, construction pipeline, AI data centres, building industry news
Q3 2026: NZ & AU Construction Hits Record Completions — But New Starts Are Falling
As a quantitative trader looking at construction as an asset-heavy, cycle‑driven sector, the latest Australia and NZ data paint a classic late‑cycle picture: record work done, weakening commencements, and widening dispersion between regions and subsectors. For engineers, project managers and contractors, this is not just macro noise — it is a forward indicator of margin pressure, bidding intensity, and where capital will flow next.
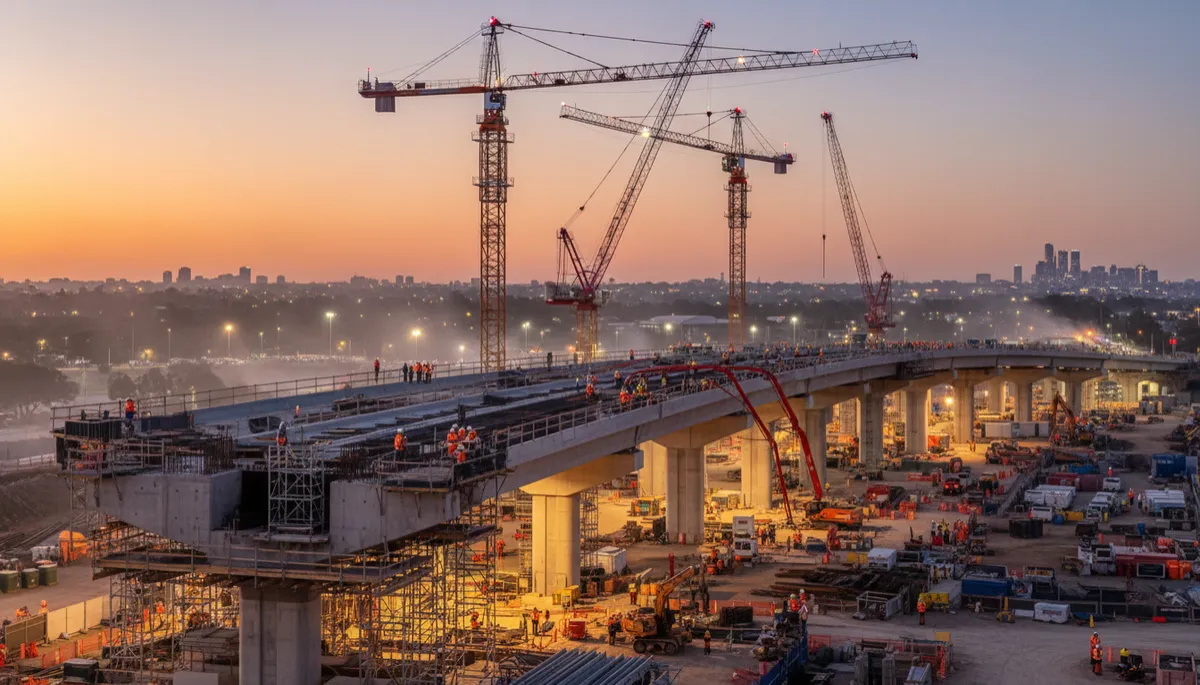
Australia: Record Work Done, But the Pipeline Is Thinning
ABS data for the quarter to March 2026 show the value of construction work done jumping 7.1% in the quarter and 5.2% over the year, nudging above the previous peak in June 2025. On any chart, that is a clear new high — confirming that Australia’s engineering construction sector is completing work at record levels.
Under the surface, however, new project commencements are falling sharply. Dwelling starts are already down double‑digits, and engineering commencements are softening. In trading terms, completions are your realised P&L; commencements are your forward book. Right now, the sector is monetising a large backlog while failing to fully replenish its construction pipeline.
The composition of activity is also shifting. The private sector spiked 15.9% in the March quarter, while the public sector dropped 3.5%. That tells us two things: public infrastructure commitments are weakening at the margin, and private operators are now competing harder over a shrinking pool of work. For contractors, that usually translates into tighter margins and more aggressive pricing; for asset owners, it can be an opportunity to lock in capacity before the next upswing in public spend.
By year‑end, Australia’s construction market is estimated in the $190–$210 billion range. Yet the next key inflection point will be the new ABS data covering to June 2026, due for release imminently. From a market‑timing perspective, that release is the equivalent of an earnings report: if commencements deteriorate further, we should expect even fiercer tender competition through 2027.
Regional Divergence and the AI Data Centre Bright Spot
The national aggregates mask strong regional dispersion. Queensland and Western Australia are gaining construction momentum, supported by resources, defence, and logistics corridors — with the Brisbane 2032 Olympics already shaping early transport and venue‑adjacent opportunities. In contrast, Victoria remains subdued, with softer private demand and slower public program ramp‑ups, making it a structurally more competitive, lower‑margin bidding environment for the next 12–24 months.
One of the clearest growth themes is AI data centres and digital infrastructure. Across Sydney, Melbourne, Brisbane and Perth, new hyperscale and edge facilities are breaking ground, backed by global cloud providers and domestic telecoms. For a trader, this is a sector‑rotation story: capital is rotating from broad‑based public infrastructure into more targeted, high‑power, high‑spec assets with long‑dated offtake contracts and relatively resilient demand.
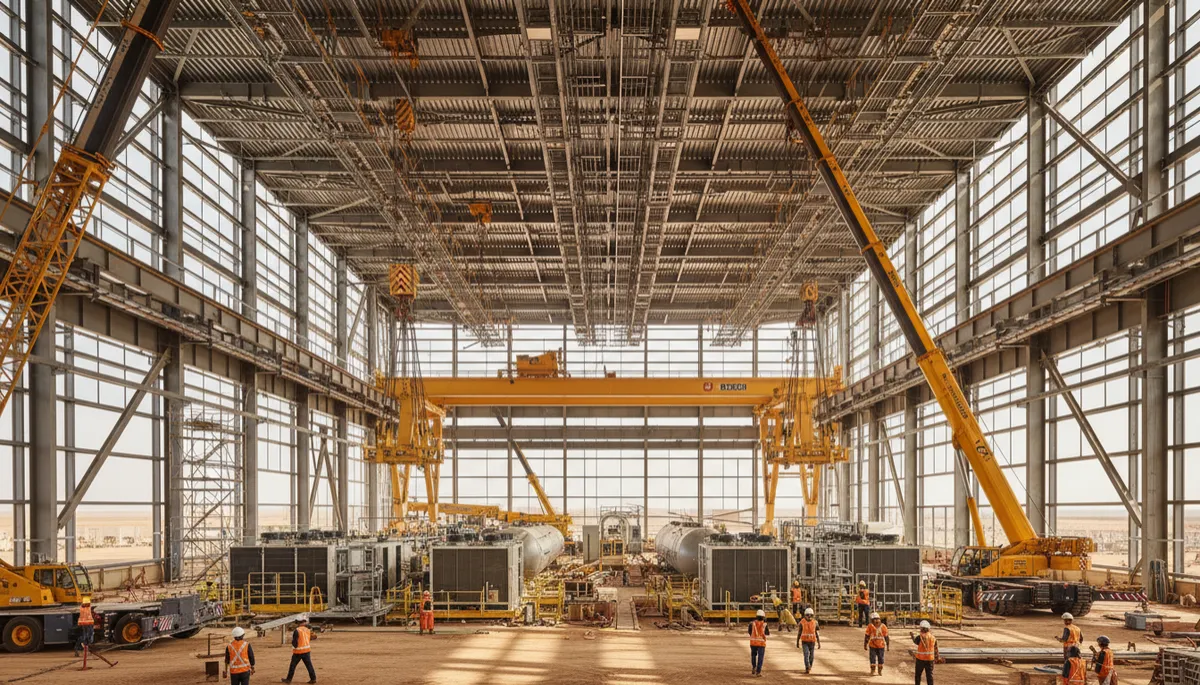
AI data centres are emerging as a defensive growth subsector within the Australian construction market.
New Zealand: Flat Activity, Early Stabilisation and Election Tailwinds
The NZ construction 2026 outlook is more muted in absolute terms but potentially attractive on a relative‑value basis. The market is estimated at $55–$65 billion for 2026, broadly flat on 2025. Macro conditions are soft: the economy contracted 0.9% in the June quarter, the third decline in five quarters, and the Reserve Bank cut the OCR to 3.0% in August 2026, with further easing expected as inflation moderates.
Construction activity remains subdued, but there are early signs of stabilisation. Crane counts are edging higher, and infrastructure pipelines are projected to strengthen ahead of the 2026 national election as parties sharpen their transport, resilience and housing pitches. In labour markets, SEEK data show a 35% increase in NZ construction job listings in the 12 months to March 2026, calling the sector an “engine of annual growth” for employment even as GDP weakens — a classic sign that firms are positioning for the next cycle rather than capitulating.
That said, the scars of the downturn are visible. New Zealand’s building and construction sector lost 551 companies between 2023 and 2025. The positive note is that credit arrears have started to improve in H1 2026, suggesting the worst of the balance‑sheet stress may be behind the sector, provided rates continue to ease and public infrastructure spend materialises as flagged.
Cost, Labour and Geopolitics: Macro Risks to Project Returns
For both the Australian construction market and New Zealand, labour shortages and rising material costs remain persistent constraints. Wage growth for key trades continues to outpace pre‑pandemic norms, while the global Iran conflict is contributing to higher ocean freight and energy costs. That feeds directly into imported steel, electrical equipment and fuel, sustaining construction cost inflation even as demand starts to cool.
From a risk‑management standpoint, project owners and contractors should treat these as basis risks on their future cash flows. Fixed‑price contracts signed in 2023–2024 are now being delivered into a cost environment shaped by elevated freight and energy prices. Where possible, indexation clauses, hedged commodity exposures, and diversified supplier bases are the operational equivalents of options hedges in a trading book.
Strategy Lens: Positioning Engineering Firms for the Next Phase
| Segment / Region | Cycle Signal (Q3 2026) | Suggested Positioning for Firms |
|---|---|---|
| AU engineering construction (national) | Late‑cycle, record completions, weaker starts | Prioritise margin discipline, pre‑qualify selectively, extend client relationships |
| QLD & WA infrastructure | Upswing, capacity tightening | Add capacity, lock in long‑term frameworks, price in cost risk |
| AU AI data centres / digital | Structural growth, high spec | Build specialist capability, pursue repeat‑client programs, focus on reliability |
| NZ infrastructure (pre‑election) | Early recovery, policy‑driven | Prepare bids early, partner on alliances, manage balance‑sheet conservatively |
Key Takeaways for Engineering and Construction Leaders
- AU and NZ are both at or near record levels of work done, but new starts are weakening, especially in Australia — signalling tougher competition ahead.
- Private‑sector activity is carrying Australia (up 15.9%) as public work falls 3.5%; firms should deepen relationships with private capital while monitoring policy risk on infrastructure.
- NZ’s flat NZ construction 2026 outlook hides improving credit quality, rising job ads, and potential pre‑election infrastructure commitments — an asymmetric upside if rates keep falling from the 3.0% OCR.
- AI data centres and digital infrastructure in Australia, plus QLD/WA transport and energy projects, offer the clearest medium‑term growth narrative within an otherwise maturing cycle.
- Geopolitically driven cost risks — especially from the Iran conflict’s impact on freight and energy — make robust escalation mechanisms, hedging and supply‑chain diversification non‑negotiable.
Forward View: Navigating a Late‑Cycle, Data‑Driven Market
For engineering firms, contractors, and developers in Australia and New Zealand, Q3 2026 is not a time for complacency. The headline numbers still look strong, but the leading indicators — commencements, public spend trajectories, labour availability and freight‑driven costs — point to a more selective, data‑driven market ahead. The firms that will outperform are those that treat macro data the way traders treat price action: as continuous feedback for where to deploy capital, where to defend margin, and when to step back from risk.
In practical terms, that means building internal dashboards that track ABS and Stats NZ releases, tender‑price indices, and sector‑specific demand (such as AI data centres and transport corridors), then aligning bid strategy and workforce planning accordingly. The cycle is maturing, but for disciplined, information‑advantaged players, the next 12–24 months can still offer strong risk‑adjusted returns — both on the balance sheet and on site.


