
Australia's Record 896 Cranes in Q3 2026
Construction Industry News, Australia construction record, RLB Crane Index Q3 2026
Australia Hits All-Time Construction Record: 896 Cranes Now Active Nationwide
Australia’s construction sector has reached a new high-water mark, with the latest RLB Crane Index Q3 2026 confirming record crane activity and signalling a robust, if uneven, pipeline across key metropolitan and infrastructure markets in Australia and New Zealand.

National Crane Count Reaches Historic Peak
The RLB Crane Index Q3 2026 confirms that 896 cranes were operating across Australia in the September quarter, the highest number ever recorded on major construction sites nationwide (RLB). This new Australia construction record lifts the national RLB Crane Index to 210 points, up from 197 in Q1 2026, representing a 6.7% increase in crane numbers over six months as activity accelerates across both residential and non-residential sectors.
Behind the headline figure, the churn on sites has been significant. Nationally, 370 cranes were added to major projects between Q1 and Q3 2026, while 314 were removed. The net increase of 56 cranes underscores a construction market that is not only busy but actively transitioning from completed schemes into a new wave of work, particularly in infrastructure, data centres and health facilities.
Melbourne Surges to Record High, Infrastructure Leads the Charge
Melbourne has been one of the standout performers of the current cycle. The city recorded 224 cranes in Q3 2026, its highest tally on record and above the previous peak of 222 in Q1 2019. Over the six months, Melbourne added a net 21 cranes, reflecting strong momentum across both housing and major transport infrastructure.
Residential work remains central to this upswing. According to RLB, 48% of Melbourne’s cranes are now on residential projects, up from 41% in Q1. This aligns with Australian Bureau of Statistics data showing residential construction increased 8.1% in 2025–26, including a 13.2% lift in apartment and townhouse activity. For developers, engineers and contractors, this reinforces Melbourne’s position as a key market for medium- and high-density delivery over the coming years.
Major infrastructure is also a defining feature of the city’s skyline. The North East Link and Suburban Rail Loop together account for 42 cranes, or around 19% of Melbourne’s total. These megaprojects are not only reshaping transport networks but providing long-duration workloads for civil contractors, structural engineers and specialist trades, anchoring the local pipeline even as private-sector demand cycles.
Sydney Still Leads, but Market Softens Slightly
Despite Melbourne’s surge, Sydney remains Australia’s largest crane market, with 336 cranes active in Q3 2026. However, this represents a modest decline from 346 cranes in Q1, indicating a slight cooling in some segments, particularly where feasibility has been pressured by higher funding and construction costs.
Sydney’s skyline is still overwhelmingly shaped by housing-led work. Residential and mixed-use projects account for 83% of crane activity, underlining the city’s ongoing densification and the continued demand for infill and transit-oriented development. For consultants and builders, the challenge is to manage delivery risk and procurement complexity in a market where end demand remains solid, but cost and margin pressures are acute.
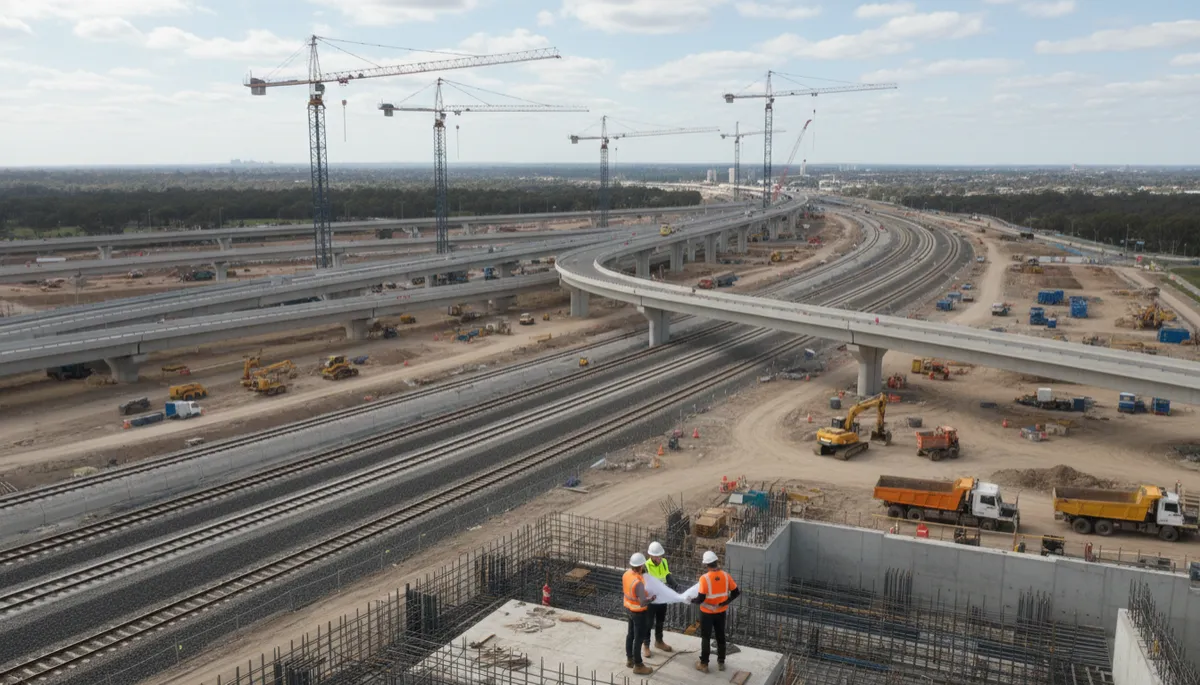
Transport and health infrastructure, along with data centres, are now core drivers of crane demand.
Residential and Non-Residential Indices Point to Broad-Based Growth
The sectoral breakdown within the RLB Crane Index Q3 2026 indicates that growth is not confined to a single asset class. Nationally, the residential index rose from 150 to 166 points, while the non-residential index increased from 323 to 330 points. These gains align with ABS figures showing non-residential construction up 9.3% in 2025–26, supported by strong pipelines in data centres, health infrastructure, major transport projects and large-scale mixed-use developments.
For industry participants, the message is clear: while residential work continues to underpin volumes, non-residential and infrastructure are increasingly critical to balancing portfolios and smoothing cycles. The rapid expansion of data centre capacity, in particular, is creating demand for highly specialised engineering, power, and cooling solutions across several Australian markets.
Queensland, Western Australia and the Skills Pipeline
Beyond the two largest cities, Queensland and Western Australia are gaining momentum. South-East Queensland in particular is benefitting from early-stage works and enabling projects linked to the Brisbane 2032 Olympics, driving elevated levels of civil, transport and precinct development. In WA, resources-linked investment and logistics infrastructure continue to underpin steady crane activity in Perth and key regional hubs.
Sustaining this record level of work will, however, depend heavily on workforce capacity. In recognition of a well-documented skilled labour shortage, the Australian Government has launched a $78 million Advanced Entry Trades Training (AETT) program. The initiative aims to fast-track free qualifications for around 6,000 experienced construction workers, helping contractors and engineers access the supervisory and specialist skills needed to deliver increasingly complex infrastructure and vertical projects at scale.
New Zealand: Modest Crane Uptick Amid Challenging Conditions
Across the Tasman, the latest RLB data points to a more subdued but cautiously positive trend. The New Zealand crane count rose from 102 in Q1 2026 to 106 in Q3 2026, with the national RLB Crane Index lifting from 129 to 134 points. While this is a modest increase compared with Australia’s record-breaking performance, it represents a welcome stabilisation following a prolonged downturn in some NZ markets.
RLB notes that New Zealand’s infrastructure sector is showing resilience despite broader market weakness, with civil and transport projects helping to underpin workloads for contractors and consultants. For NZ-based engineers and project teams, the focus remains on managing cost escalation and delivery risk, while leveraging government-backed pipelines in transport, health and education to offset softer residential and commercial demand.
Outlook: What the Record Crane Count Means for the Sector
The combination of a record 896 cranes in Australia, rising RLB Crane Index scores, and solid growth across both residential and non-residential segments sends a clear signal to the NZ/AU construction community: the medium-term pipeline is substantial, but execution will be challenging. Capacity constraints, cost volatility and labour shortages will continue to shape project strategies, procurement models and risk allocation.
For industry professionals, the priority now is to align capability with this elevated workload. That means investing in skills, strengthening supply chains, and leveraging digital tools to improve productivity on complex infrastructure, data centre and health projects. With Brisbane 2032 preparations gathering pace and New Zealand’s infrastructure sector quietly rebuilding, the current cycle offers significant opportunities for well-prepared contractors, engineers and developers across the region.


